Management
Dental Practice Financial Dashboard: What Should It Include?
A practical guide to the financial metrics every dental practice owner should track to understand profitability, costs, margins, productivity, and financial health.

Most dental practices already track production, collections, and appointment volume. But those numbers alone do not show whether the practice is truly profitable.
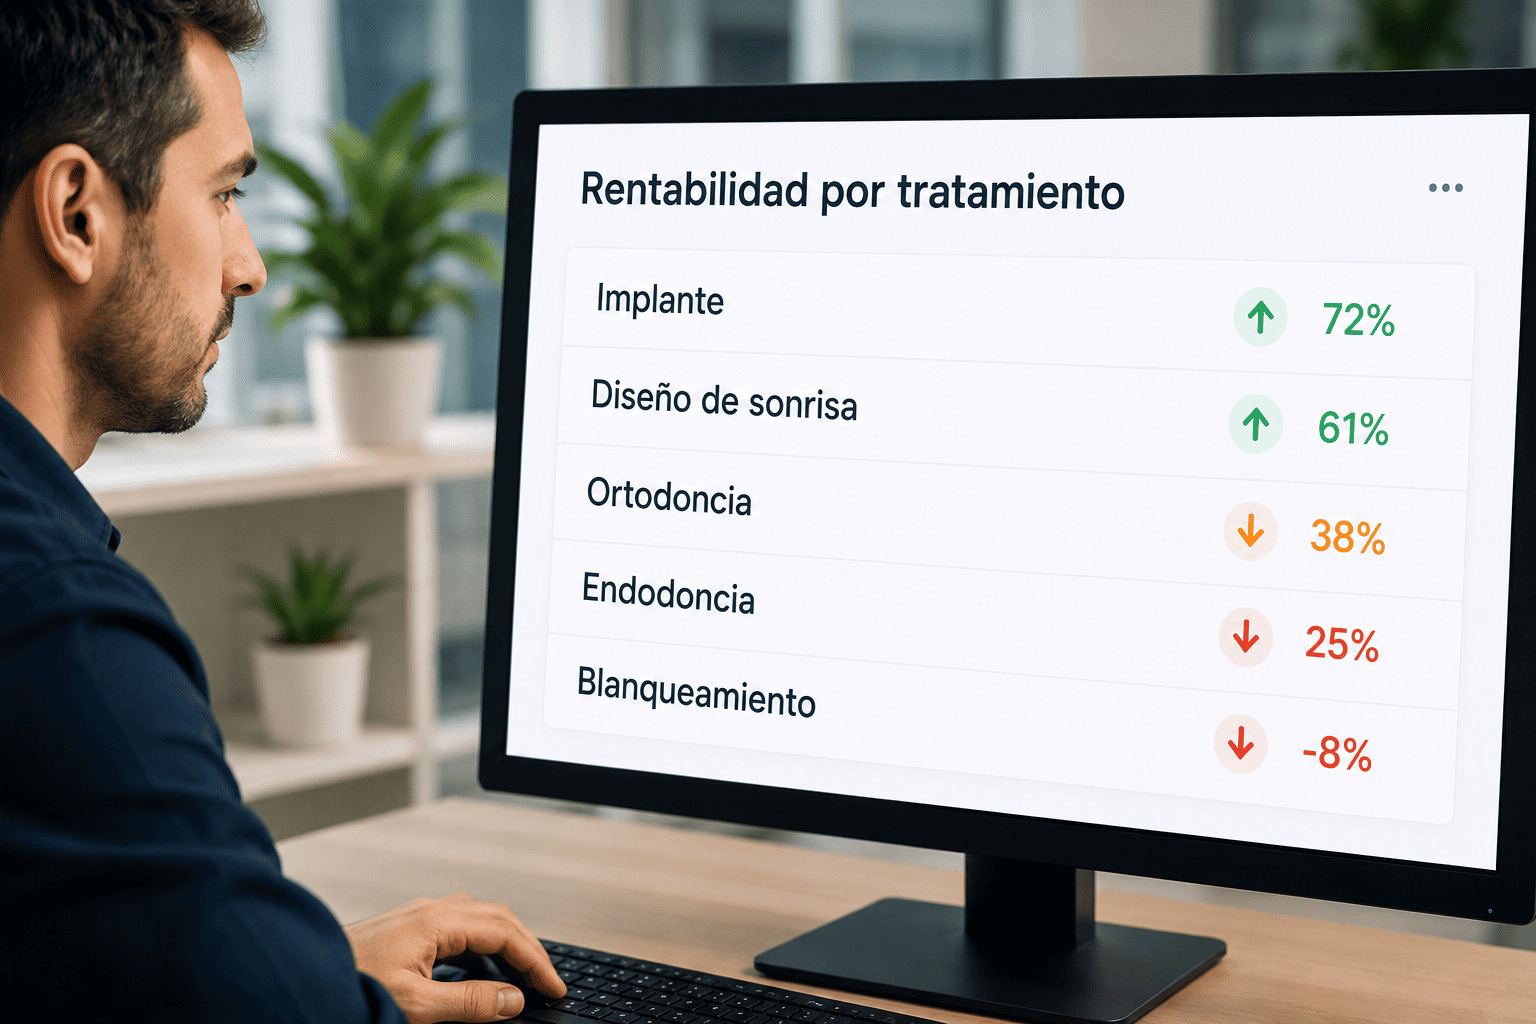
A dental practice financial dashboard should help owners understand what is happening behind the revenue: how much treatments really cost, which procedures generate strong margins, how overhead affects profitability, and whether clinical time is being used efficiently.
The best dashboard is not just a collection of numbers. It is a decision-making system that helps the practice identify problems early, protect margins, and grow with more confidence.
What Is a Dental Practice Financial Dashboard?
A financial dashboard is a clear view of the key numbers that determine the health of a dental practice. It should show more than production. It should reveal profitability, cost structure, margins, overhead, pricing, productivity, and cash flow signals.
In many practices, financial information is spread across accounting reports, practice management software, spreadsheets, marketing dashboards, and manual calculations. The result is fragmented visibility.
A useful dashboard brings those insights together so owners can understand how the practice is performing and where decisions need to be made.
Why Revenue Alone Is Not Enough
Revenue shows how much money comes into the practice. But it does not show how much money the practice keeps.
A practice can generate strong revenue and still have weak margins if treatment costs, overhead, payroll, marketing, or chair time are not controlled.
Revenue alone does not tell you:
- Which treatments are profitable
- Which procedures consume too much time
- Whether pricing is sustainable
- How overhead affects margins
- Which providers generate the strongest returns
- Where the practice is losing money
The Essential Metrics Every Dental Financial Dashboard Should Include
Every practice is different, but a strong financial dashboard should help owners understand profitability from several angles.
Important dashboard metrics include:
- Revenue
- Net profit margin
- Cost per procedure
- Cost per clinical hour
- Overhead percentage
- Profitability by treatment
- Profitability by provider
- Patient acquisition cost
These metrics help connect daily clinical activity with the financial reality of the business.
Procedure Cost Metrics
One of the most important sections of any dental practice dashboard is treatment cost visibility. Without it, pricing and profitability decisions are often based on assumptions.
A procedure cost dashboard should include:
- Clinical materials
- Laboratory expenses
- Provider compensation
- Chair time
- Staff costs
- Practice overhead
- Patient acquisition cost
- Net profit margin
When these costs are measured together, the practice can understand whether each treatment is truly profitable.
Productivity Metrics
A dental practice does not only sell treatments. It also sells clinical time. Every hour in the chair has a financial cost and a financial opportunity.
A strong dashboard should track:
- Revenue per clinical hour
- Profit per clinical hour
- Schedule utilization
- Chair time by procedure
- Provider productivity
- Unproductive clinical time
These metrics help owners understand whether the practice is using clinical capacity efficiently.
Overhead Visibility
Overhead is one of the most important drivers of profitability. If operating expenses grow faster than margins, the practice may become busier without becoming more profitable.
Common overhead categories to monitor include:
- Rent
- Software
- Payroll
- Utilities
- Insurance
- Equipment maintenance
- Marketing
- Administrative expenses
The dashboard should not only show overhead totals. It should also help owners understand how overhead affects treatment cost and minimum profitable fees.
Pricing Insights
A financial dashboard should help answer one of the hardest questions in dentistry: are our fees financially sustainable?
Useful pricing insights include:
- Minimum profitable fee
- Target profit margin
- Current fee vs. recommended fee
- Low-margin treatments
- Procedures affected by rising costs
- Pricing scenarios
This is especially important when material costs, payroll, laboratory fees, or marketing expenses increase.
Warning Signals Your Dashboard Should Reveal
The best financial dashboards make problems visible before they become serious. Instead of waiting until profit disappears, owners can identify early warning signs.
Important signals include:
- Revenue is growing but profit is not
- Procedure margins are declining
- Overhead is increasing too quickly
- Patient acquisition cost is too high
- Chair time is being used inefficiently
- Certain procedures are underperforming
These signals help owners understand where to investigate and which decisions may have the greatest impact.
Common Mistakes When Building a Dental Financial Dashboard
Many dashboards look impressive but fail to support real financial decision-making. The problem is usually that they track surface-level activity instead of true profitability.
Common mistakes include:
- Tracking only revenue
- Ignoring procedure-level profitability
- Using outdated cost assumptions
- Not including overhead
- Not measuring chair time
- Reviewing numbers too late
A useful dashboard should be simple enough to understand but complete enough to reveal the economics of the practice.
How Klynic Works as a Financial Dashboard for Dental Practices
Klynic was built to give dental practices clearer financial visibility without relying on complicated spreadsheets.
With Klynic, practice owners can:
- Calculate true treatment costs
- Analyze margins by procedure
- Understand cost per clinical hour
- Visualize overhead impact
- Identify low-performing treatments
- Compare pricing scenarios
- Make decisions with real financial data
Instead of only seeing production numbers, Klynic helps practices understand true profitability, pricing, margins, overhead, and treatment-level financial performance.
Final Thoughts
A dental practice financial dashboard should do more than display revenue. It should help owners understand how the business is really performing.
The most valuable dashboard connects revenue with costs, margins, overhead, clinical productivity, pricing, and procedure-level profitability.
When those numbers are visible, practice owners can make smarter decisions, protect margins, and grow with greater confidence.
How Klynic works as a financial dashboard for dental practices
Klynic helps dental practices calculate true treatment costs, measure margins, understand overhead, analyze clinical hour costs, and make pricing decisions based on real financial data.
- True treatment cost visibility
- Profitability by procedure
- Overhead and chair time analysis
- Pricing scenarios backed by data